Brief Review — Heart Sound Classification Algorithm Based on Sub-band Statistics and Time-frequency Fusion Features
Multi-Feature + CNN-1D
4 min readApr 27, 2024

Heart Sound Classification Algorithm Based on Sub-band Statistics and Time-frequency Fusion Features
Multi-Feature + CNN-1D, by Yunnan University
2023 CACML (Sik-Ho Tsang @ Medium)Phonocardiogram (PCG)/Heart Sound Classification
2013 … 2023 … [DL Overview] [WST+1D-CNN and CST+2D-CNN Ensemble] [CTENN] [Bispectrum + ViT]
==== My Other Paper Readings Are Also Over Here ====
- The statistical moments (mean, variance, skewness and kurtosis), normalized correlation coefficients between sub-band and sub-band modulation spectrum are extracted from each sub-band envelope of the heart sound signal.
- These 3 features are fused into fusion features by Z-score normalization method. Finally, a convolutional neural network classification model CNN-1D, is used for heart sound classification.
Outline
- Multi-Feature + CNN-1D
- Results
1. Multi-Feature + CNN-1D
1.1. Pre-Processing
- In this study, 5s of each heart sound signal was randomly intercepted. it was pre-emphasized, framed, windowed, and normalized.
- A fixed frame length of 0.1 s and a step shift of 0.05 s were used, and a Hamming window was added to the signal to reduce frequency leakage and the effect of partials.
1.2. Feature Extraction

- The pre-processed one-dimensional heart sound signal is decomposed by a Mel-scale auditory filter set.
- Calculate the Hilbert envelope of the sub-band signal.


1.2.1. Feature Block One
- 4 statistical moments of mean, variance, skewness and kurtosis are obtained for the sub-band envelope to obtain a 72 (18×4) dimensional feature block.
1.2.2. Feature Block Two
- Fast Fourier transform is performed on the sub-band envelope signal. Its spectrum is divided into 6 spectral bands.
- Each spectral band is normalized by its sub-band variance to obtain 6 modulated spectral bands, and finally a 108 (18×6) dimensional feature block is obtained.
1.2.3. Feature Block Three
- Pearson correlation coefficient matrix (18 × 18 matrix) between the sub-band signals and grabbing the diagonal from it.

1.2.4. Feature Fusion
- The 3 feature blocks are fused into one-dimensional fused features.
- The Z-score normalization method is used to normalize the 3 feature data.
1.3. CNN-1D Model
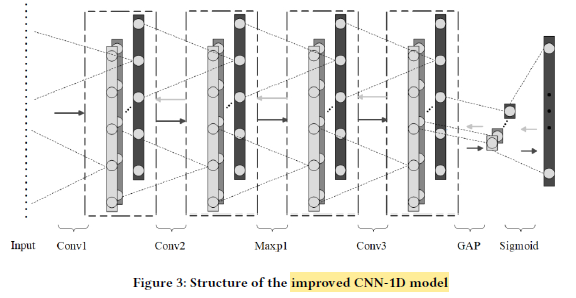
- The first convolutional layer of the model adopts a large size 64×1 convolutional kernel.
- The second convolutional layer adopts a 2×1 small-sized convolutional kernel.
- The third convolutional layer is unknown. (No details in the paper. Or the figure is wrongly drawn?)
- Global average pooling (GAP) is used.
2. Results
- Two heart sound datasets were used in this study.
- One dataset was the “Precocious Heart Sound Sample Dataset” (the subject dataset). A total of 5000 heart sound samples were used in this study, including 2500 normal heart sound samples and 2500 abnormal (with precordial disease).
- The other dataset used was the “Heart Sound Challenge PhysioNet/CinC 2016 public dataset.”, which has a total of 3240 heart sound samples.

- Among all features, the fused fature one is the best.
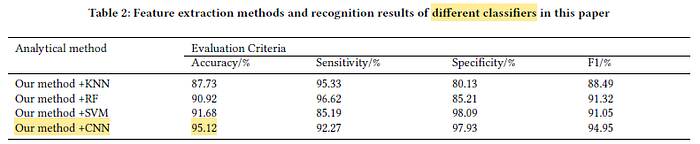
- Among KNN, RF and SVM classifiers, the best performance one is NN classifiers built.
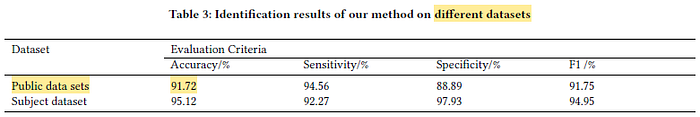
- The specificity index of this paper’s method is lower on the public dataset, probably due to the unbalanced number of normal and abnormal heart sound samples in the public dataset.