[Review] Grad-CAM: Visual Explanations from Deep Networks via Gradient-based Localization (Weakly Supervised Object Localization)
Class-Discriminative Visualization, Applicable to Wide Variety of CNN Models

In this story, Grad-CAM: Visual Explanations from Deep Networks via Gradient-based Localization, Grad-CAM, by Georgia Institute of Technology, and Facebook AI Research, is shortly presented. In this paper:
- Grad-CAM is applicable to a wide variety of CNN model-families.
- It creates a class-discriminative visualization.
- It also lend insights into failure modes of the model.
Due to the above advantages, indeed it is not just used for WSOL, but also other tasks, which makes this paper gaining high citations. This is a paper in 2017 ICCV with over 3200 citations. (Sik-Ho Tsang @ Medium)
Outline
- Grad-CAM
- Guided Grad-CAM
- Weakly Supervised Object Localization (WSOL)
- Evaluating Class Discrimination & Trust
- Diagnosing Image Classification CNNs
- Visualizations for Other Tasks
1. Grad-CAM

Grad-CAM uses the gradient information flowing into the last convolutional layer of the CNN to understand the importance of each neuron for a decision of interest.
- As shown above, in order to obtain the class-discriminative localization map Grad-CAM, the gradient of the score for class c, yc (before the softmax) is computed, with respect to feature maps Ak of a convolutional layer, i.e. 𝛿yc/𝛿Ak.
- These gradients flowing back are global-average-pooled to obtain the neuron importance weights αck:

- This weight αck represents a partial linearization of the deep network downstream from A, and captures the ‘importance’ of feature map k for a target class c.
- A weighted combination of forward activation maps is performed, and follow ReLU:

- This results in a coarse heat-map of the same size as the convolutional feature maps LcGrad-CAM (14 × 14 in the case of last convolutional layers of VGGNet and AlexNet networks).
- Applying a ReLU to the linear combination of maps because we are only interested in the features that have a positive influence on the class of interest, i.e. pixels whose intensity should be increased in order to increase yc.
- Negative pixels are likely to belong to other categories in the image.
- As expected, without this ReLU, localization maps sometimes highlight more than just the desired class and achieve lower localization performance.
- In general, yc need not be the class score produced by an image classification CNN. It could be any differentiable activation including words from a caption or the answer to a question.
2. Guided Grad-CAM

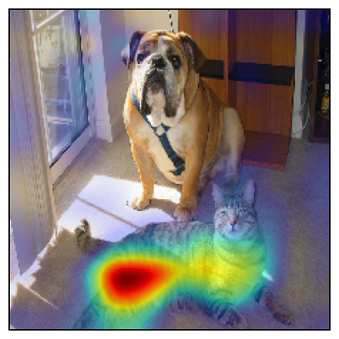
- For example, Grad-CAM can easily localize the cat region. However, it is unclear from the low-resolutions of the heat-map why the network predicts this particular instance as ‘tiger cat’.
- Guided Grad-CAM is produced by fusing Guided Backpropagation (Backprop) and Grad-CAM visualizations via pointwise multiplication (LcGrad-CAM is first up-sampled to the input image resolution using bi-linear interpolation).
- This visualization is both high-resolution (when the class of interest is ‘tiger cat’, it identifies important ‘tiger cat’ features like stripes, pointy ears and eyes) and class-discriminative (it shows the ‘tiger cat’ but not the ‘boxer (dog)’).
3. Weakly Supervised Object Localization (WSOL)

- Given an image, first obtain class predictions from our network and then generate Grad-CAM maps for each of the predicted classes and binarize with threshold of 15% of the max intensity.
- This results in connected segments of pixels and we draw our bounding box around the single largest segment.
- Grad-CAM achieves better top-1 localization error than CAM, which requires a change in the model architecture, necessitates re-training and thereby achieves worse classification errors (2.98% increase in top-1), whereas Grad-CAM makes no compromise on classification performance.
- Simply Deconvolution can be used but it brings artifacts.
4. Evaluating Class Discrimination & Trust

4.1. Class Discrimination
- Four techniques: Deconvolution, Guided Backpropagation, and Grad-CAM versions of each these methods (Deconvolution Grad-CAM and Guided Grad-CAM).
- Visualizations are shown to 43 workers on Amazon Mechanical Turk (AMT) and ask them “Which of the two object categories is depicted in the image?”.
- 90 image-category pairs (i.e. 360 visualizations) are conducted. 9 ratings were collected.
- When viewing Guided Grad-CAM, human subjects can correctly identify the category being visualized in 61.23% of cases (compared to 44.44% for Guided Backpropagation; thus, Grad-CAM improves human performance by 16.79%). Similarly, we also find that Grad-CAM helps make Deconvolution more class-discriminative (from 53.33% to 61.23%).
- Guided Grad-CAM performs the best among all the methods.
4.2. Trust
- Considering only those instances where both models made the same prediction as ground truth.
- Given a visualization, 54 AMT workers were instructed to rate the reliability of the models relative to each other on a scale of clearly more/less reliable (+/-2), slightly more/less reliable (+/-1), and equally reliable (0).
- it is found that human subjects are able to identify the more accurate classifier (VGG over AlexNet) simply from the different explanations, despite identical predictions.
5. Diagnosing Image Classification CNNs

- To analyze failure modes, first get a list of examples that the network (VGG-16) fails to classify correctly.
- A major advantage of Guided Grad-CAM visualization over other methods that allows for this analysis is its high-resolution and its ability to be highly class-discriminative.
Humans would find it hard to explain some of these predictions without looking at the visualization for the predicted class. But with Grad-CAM, these mistakes seem justifiable.
We can also see that seemingly unreasonable predictions have reasonable explanations.
6. Visualizations for Other Tasks


- For more details about other tasks, please feel free to visit the paper.
Reference
[2017 ICCV] [Grad-CAM]
Grad-CAM: Visual Explanations from Deep Networks via Gradient-based Localization
Weakly Supervised Object Localization (WSOL)
2014 [Backprop] 2016 [CAM] 2017 [Grad-CAM] [Hide-and-Seek] 2018 [ACoL] [SPG] 2019 [ADL]
