[Review] SAOL: Spatially Attentive Output Layer (Image Classification & Weakly Supervised Object Localization)
Better Accuracy by Replacing GAP-FC Layers With SAOL, Outperforms ABN & Residual Attention Network

In this story, Spatially Attentive Output Layer for Image Classification, SAOL, by Kakao Brain, is presented. In this story:
- The previous GAP-FC layer is replaced with a spatially attentive output layer (SAOL) by employing a attention mask on spatial logits.
- The proposed location-specific attention selectively aggregates spatial logits within a target region, which leads to not only the performance improvement but also spatially interpretable outputs.
- SAOL also permits to fully exploit location-specific self-supervision as well as self-distillation to enhance the generalization ability during training, which can be easily plugged into existing CNNs.
This is a paper in 2020 CVPR with so far 3 citations since it is still a new paper. (Sik-Ho Tsang @ Medium)
Outline
- Conventional GAP-FC-Based CNN
- Spatially Attentive Output Layer (SAOL)
- Self-Supervised Losses
- Self-Distillation Losses
- Image Classification Results
- Weakly Supervised Object Localization (WSOL) Results
1. Conventional GAP-FC-Based CNN
- In conventional CNN which use Global Average Pooling (GAP) then Fully Connected (FC) layers at the end of the network, the GAP-FC based output layer OGAP-FC(·) can be formulated as:

- where XL is the L-th layer feature map, and xLGAP is the spatially aggregated feature vector by GAP, that is:

- where Hl and Wl are the height and width of the lth block.
Instead of this aggregation on the last feature map, the proposed method produces output logits explicitly on each spatial location and then aggregates them selectively through the spatial attention mechanism.
2. Spatially Attentive Output Layer (SAOL)

- The proposed SAOL, OSAOL(·), first produces Spatial Attention Map, A ∈ [0, 1]Ho×Wo , and Spatial Logits, Y ∈ [0, 1]K×Ho×Wo, separately.
- The attention values are normalized via softmax across the spatial positions while we take softmax on the spatial logits across classes:

- Then, the final output logits are generated by a spatially weighted sum of the spatial logits as follows:
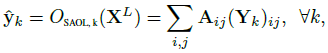
- where ˆyk is the output logit of the kth class.
These attention weights indicate the relative importance of each spatial position regarding the classification result.
- Specifically, first, to obtain the spatial attention map A, we feed the last convolutional feature maps XL into two-layered convolutions followed by the softmax function.
- Motivated by previous decoder modules for semantic segmentation, multiscale spatial logits are combined.
- In specific, at each of the selected blocks, the feature maps are mapped to the intermediate spatial logits through convolutions after resized to the output spatial resolution.
- Then, a set of the intermediate spatial logits are concatenated and re-mapped to the final spatial logits Y by another convolution layer and the softmax function.
In contrast to CAM and Grad-CAM, SAOL can directly generate spatially interpretable attention outputs or target object locations using A and Y in a feed-forward manner. (Please feel free to visit CAM and Grad-CAM if interested.)
3. Self-Supervised Losses
- Two novel spatial losses are added which inspired by CutMix and self-supervised learning methods.
- CutMix generates a new training sample (x′, y′) by mixing a certain sample (xB, yB) and a random patch extracted from an another sample (xA, yA) as follows:

- where M denotes a binary mask for cropping and pasting a rectangle region.
- (Please feel free to visit CutMix if interested.)
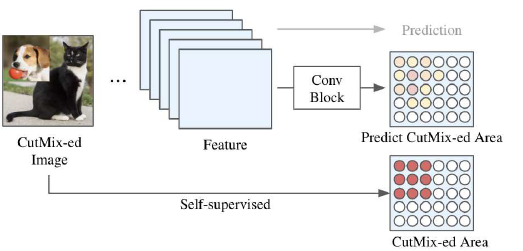
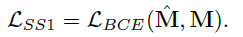
- Given a CutMix-ed input image, M is used as an additional ground truth label to estimate the first self-supervised binary cross-entropy loss LSS1:

- The second self-supervised loss LSS2 is to match the spatial logits in the pasted region of the mixed input with the spatial logits in the cut region of the original data as follows:
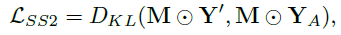
- where DKL represents the average Kullback–Leibler divergence over spatial locations, and YA denotes the spatial logits of xA.
These losses can lead to spatially consistent feature representations and accordingly, improved performances.
4. Self-Distillation Losses
- Since one can insert the proposed SAOL in the existing CNNs, both the previous GAP-FC based output layer and SAOL are utilized:
- A self-distillation loss LSD is devised with the two final output logits separately obtained by the two output layers from a given input image:

- where β = 0.5.
- At test-time, only one of the two output modules is used to produce the classification result.
- If we select the GAP-FC based output layer, we can improve the classification performances of the exiting CNNs without computational tax at test time.
- The final loss is:
5. Image Classification Results
5.1. CIFAR


- The proposed SAOL outperformed the baseline consistently across all models except DenseNet-100.
- In most cases for CIFAR-10, SAOL gave clear improvements over self-distilled GAP-FC.
- The proposed self-distilled GAP-FC was also consistently better than the baseline.
This means that even without spatial supervision such as object localization label, SAOL can learn spatial attention appropriately and eventually performs better than averaging features.
- This consistent improvement was also retained when CutMix or ShakeDrop is additional used during training.
5.2. ImageNet
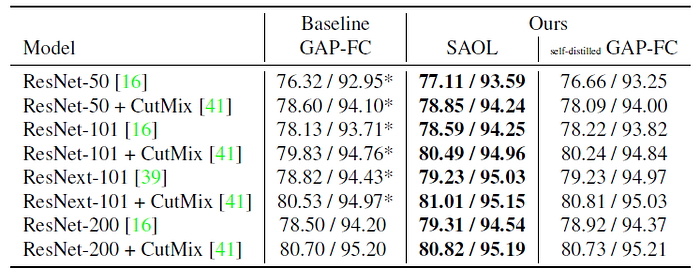
- All convolutions in SAOL are replaced with depthwise-separable convolution.
- The results indicate that models with SAOL outperformed the models with GAP-FC consistently.
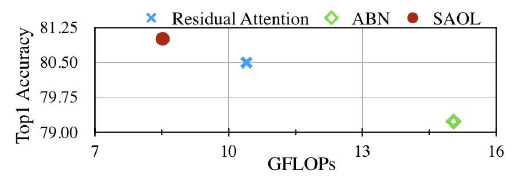
- As shown in the above figure, SAOL performed better than both of Residual Attention Network and ABN, especially even with much smaller computational cost.
- Adding our SAOL requires 6% more computations only (from 7.8 GFLOPs to 8.3 GFLOPs), which is efficient compared to the previous methods.
5.3. Ablation Study
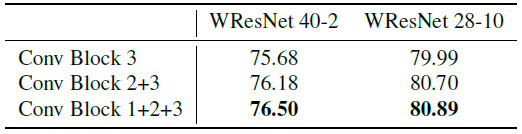
- Performances tend to be improved with more feature layers for spatial logits.
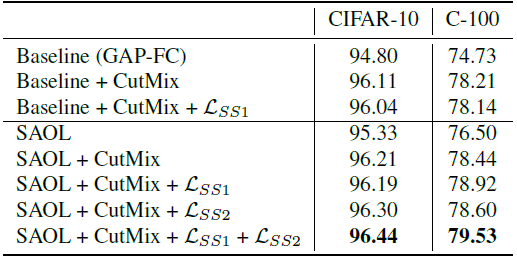
- Similar to the baseline model, SAOL was also improved with the original CutMix regularization alone. However, additional incorporating LSS1 or LSS2 further enhanced the performances.

- Instead of distilling outputs from SAOL, the standard cross-entropy (CE) loss was solely applied to the GAP-FC auxiliary layer during training.
- Irrespective of the selected output layer at test time, training both of SAOL and the GAP-FC based output layer with the same CE loss led to performance drop compared to the use of our self-distillation loss LSD, even though it still outperformed the baseline.
6. Weakly Supervised Object Localization (WSOL) Results
- A common practice in WSOL is to normalize the score maps using min-max normalization to have a value between 0 and 1. The normalized output score map can be binarized by a threshold, then the largest connected area in the binary mask is chosen.
- The model was modified to enlarge the spatial resolutions of the spatial attention map and spatial logits to be 14 × 14 from 7 × 7 and fine-tuned ImageNet-trained model.
- The spatial attention map and spatial logits are combined as an elemental-wise product to yield a class-wise spatial attention map.

- Recently proposed ABN can produce an attention map with the single forward pass; however, it modifies the backbone network with a computationally-expensive attention mechanism.
- SAOL adds much less computational taxes while it performs competitively and without any sophisticated post-processing.
- SAOL requires much fewer computations to generate an attention map for object localization.

- The above figure visualizes the spatial attention map and the spatial logits obtained by SAOL on CutMix-ed image.
- The proposed spatial attention map focuses on the regions corresponding to the general concept of objectness.
- In the situation where two objects are mixed, the attention map by SAOL localizes each object well, and moreover its scores reflect the relative importance of each object more accurately.
Reference
[2020 CVPR] [SAOL]
Spatially Attentive Output Layer for Image Classification
Image Classification
1989–1998: [LeNet]
2012–2014: [AlexNet & CaffeNet] [Dropout] [Maxout] [NIN] [ZFNet] [SPPNet]
2015: [VGGNet] [Highway] [PReLU-Net] [STN] [DeepImage] [GoogLeNet / Inception-v1] [BN-Inception / Inception-v2]
2016: [SqueezeNet] [Inception-v3] [ResNet] [Pre-Activation ResNet] [RiR] [Stochastic Depth] [WRN] [Trimps-Soushen]
2017: [Inception-v4] [Xception] [MobileNetV1] [Shake-Shake] [Cutout] [FractalNet] [PolyNet] [ResNeXt] [DenseNet] [PyramidNet] [DRN] [DPN] [Residual Attention Network] [IGCNet / IGCV1] [Deep Roots]
2018: [RoR] [DMRNet / DFN-MR] [MSDNet] [ShuffleNet V1] [SENet] [NASNet] [MobileNetV2] [CondenseNet] [IGCV2] [IGCV3] [FishNet] [SqueezeNext] [ENAS] [PNASNet] [ShuffleNet V2] [BAM] [CBAM] [MorphNet] [NetAdapt] [mixup] [DropBlock]
2019: [ResNet-38] [AmoebaNet] [ESPNetv2] [MnasNet] [Single-Path NAS] [DARTS] [ProxylessNAS] [MobileNetV3] [FBNet] [ShakeDrop] [CutMix] [MixConv] [EfficientNet] [ABN]
2020: [Random Erasing (RE)] [SAOL]
Weakly Supervised Object Localization (WSOL)
2014 [Backprop] 2016 [CAM] 2017 [Grad-CAM] [Hide-and-Seek] 2018 [ACoL] [SPG] 2019 [CutMix] [ADL] 2020 [Evaluating WSOL Right] [SAOL]